How To Use Support And Resistance Levels In Trading

Trading can be a complex and challenging endeavor, but it is a great way to make money if done correctly. One of the key components of trading is understanding support and resistance levels. These levels are vital because they can help you identify potential market trends and determine when to enter or exit trades.
What are Support and Resistance Levels?
Support and resistance levels are key areas on a chart where the price of an asset is expected to experience increased buying or selling pressure. These levels are created by traders who are buying or selling the asset, which causes the price to either rise or fall.
Support Levels
A support level is a price level where buying pressure is expected to increase, causing the price to stop falling and possibly reverse. When the price of an asset reaches a support level, it is expected to rebound and start moving upwards.
Resistance Levels
A resistance level is a price level where selling pressure is expected to increase, causing the price to stop rising and possibly reverse. When the price of an asset reaches a resistance level, it is expected to fall and start moving downwards.
How to Identify Support and Resistance Levels
Identifying support and resistance levels is essential for making informed trading decisions. There are several methods you can use to identify these levels.
Trendlines
Trendlines are one of the most popular tools for identifying support and resistance levels. A trendline is a straight line that connects two or more price points and can be used to identify potential areas of support or resistance.
Moving Averages
Moving averages are another popular tool for identifying support and resistance levels. A moving average is an average of the asset’s price over a specific period, which can help identify potential areas of support or resistance.
Pivot Points
Pivot points are a technical analysis indicator used to determine potential support and resistance levels. Pivot points are calculated based on the previous day’s high, low, and close prices and can help identify potential areas of support or resistance.
How to Use Support and Resistance Levels in Trading
Once you have identified support and resistance levels, you can use them to make informed trading decisions. Here are some ways you can use support and resistance levels in your trading strategy:
Entry Points
You can use support and resistance levels to identify potential entry points for a trade. If the price of an asset is approaching a support level, it may be a good time to enter a long position. Similarly, if the price of an asset is approaching a resistance level, it may be a good time to enter a short position.
Exit Points
You can also use support and resistance levels to identify potential exit points for a trade. If the price of an asset has reached a resistance level, it may be a good time to exit a long position. Similarly, if the price of an asset has reached a support level, it may be a good time to exit a short position.
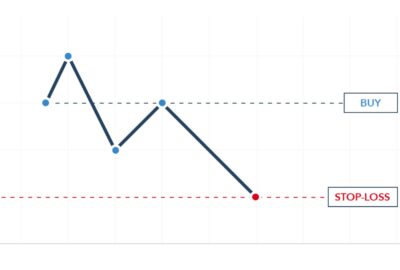
Stop Loss Orders
Stop loss orders are orders placed to automatically sell an asset when the price reaches a certain level. You can use support and resistance levels to determine where to place your stop loss orders. If the price of an asset is approaching a support level, you may want to place your stop loss order just below the support level. Similarly, if the price of an asset is approaching a resistance level, you may want to place your stop loss order just above the resistance level.
Support and resistance levels help traders identify potential market trends, determine entry and exit points, and manage risk through stop loss orders. By using tools like trendlines, moving averages, and pivot points, traders can easily identify support and resistance levels on a chart. Then, they can use these levels to make informed trading decisions, such as entering or exiting trades and placing stop loss orders.
It’s important to remember that support and resistance levels are not guaranteed to hold, and the market can break through these levels at any time. Therefore, traders should always use proper risk management techniques, such as setting stop loss orders and not risking more than they can afford to lose.
Frequently Asked Questions
- What is a support level in trading? A support level is a price level where buying pressure is expected to increase, causing the price to stop falling and possibly reverse.
- What is a resistance level in trading? A resistance level is a price level where selling pressure is expected to increase, causing the price to stop rising and possibly reverse.
- How can I identify support and resistance levels? You can identify support and resistance levels using tools like trendlines, moving averages, and pivot points.
- How can I use support and resistance levels in my trading strategy? You can use support and resistance levels to identify potential entry and exit points for trades and to determine where to place stop loss orders.
- Are support and resistance levels guaranteed to hold? No, support and resistance levels are not guaranteed to hold, and the market can break through these levels at any time. Therefore, traders should always use proper risk management techniques.